By: Andrew Cottingham
University of Evansville Alumni (2022)
Date: May 14th, 2024
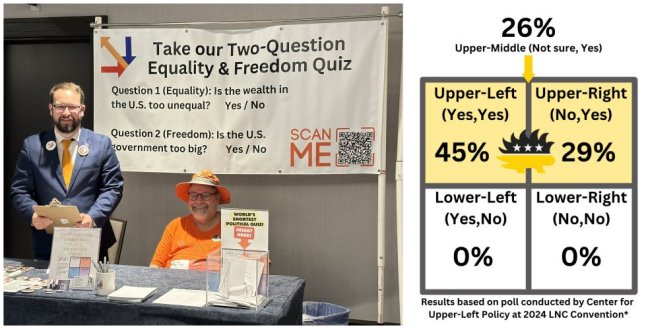
During the 2024 Libertarian National Convention, which was held in Washington D.C. between May 23-26th, Lloyd Sloan and Andrew Cottingham, on behalf of the Center for Upper-Left Policy, conducted a poll of over 100 Libertarians attending the convention. Amongst these 100 Libertarians were party members, state delegates, party leaders, candidates, and celebrities including comic and political commentator Dave Smith.
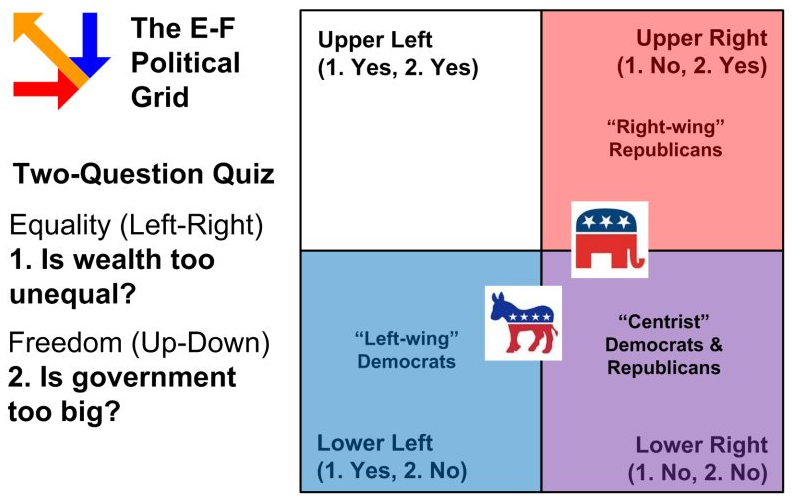
The purpose of this poll was to accurately place the Libertarian Party on the E-F Model (below*), an emerging two-dimensional political map. This model is broken down into four quadrants, which are labeled as Upper-Left, Upper-Right, Lower-Right, and Lower-Left as shown below. As explained in my other two articles, “Young Political Scientist Helps Build Case for New Political Map with TIPP Poll Results” and “The Upper-Left Position: A New Homestead for What Joe Rogan Calls the Politically Homeless,” one’s placement on the E-F Model is determined by how they answer these two questions regarding to equality and freedom.
Is the wealth in the U.S. too unequal?
Is the U.S. government too big?
The Need to Study Third Parties
Prior to our poll conducted at the Libertarian National Convention, we commissioned a national poll with the TechnoMetrica Institute of Policy and Politics back in February and March, which not only solidified the case for the accuracy of the E-F Model, but also further expanded upon its initial insights. (See previous articles for results
As a follow-up to our national poll, which did not include third parties such as the Libertarian Party and the Green Party, both Lloyd and I decided to attend the only event where we could accurately poll their members, their national party’s convention. National pollsters typically do not ask for third-party identification due to their statistical insignificance in random survey polling; however, by attending their convention, where there is a high concentration of party members, one can effectively poll this otherwise small demographic rather accurately.
Our Results & Third-Party Map
Over the course of four days, and as previously mentioned, over 100 self-identified Libertarians stopped by our booth to take our two-question quiz and help us put the Libertarian Party on the map. Here are the final results. The consensus on the size of government (freedom) question was unanimous amongst all Libertarians polled, which was found to be specifically unique to the Libertarian Party when compared to Democrats, Republicans, and Independents. Every Libertarian polled agreed that the size of the U.S. government is too big, which was to be expected.
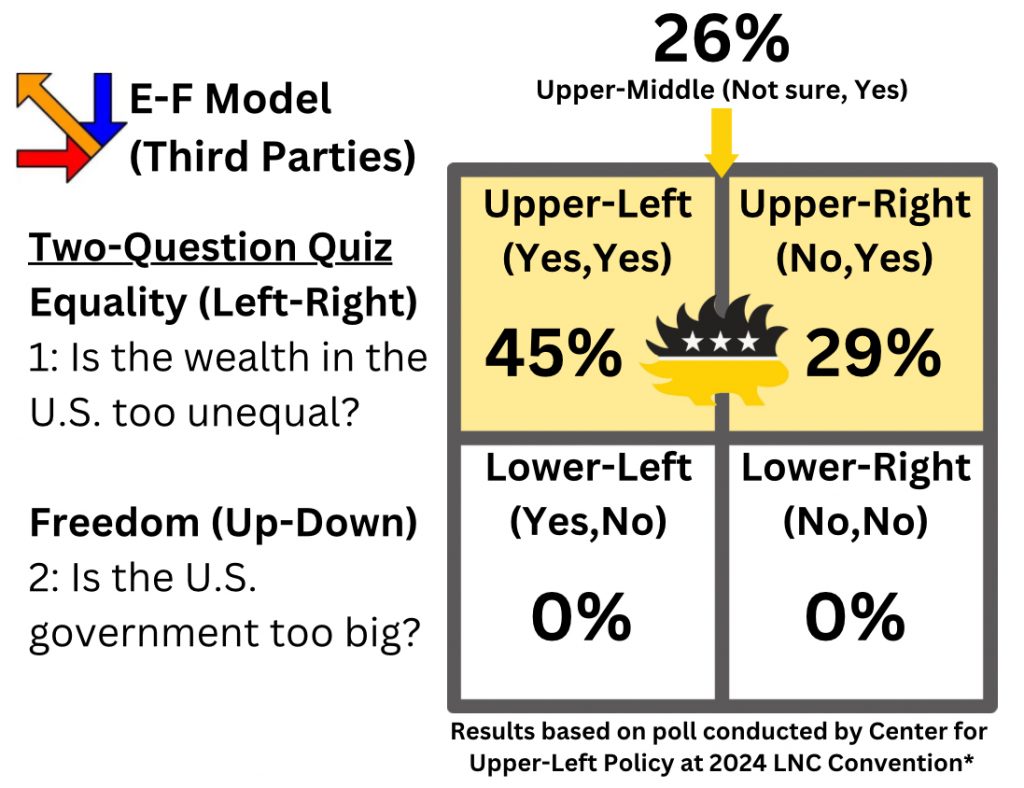
However, the question regarding wealth inequality (equality) was where differences in opinion began to appear amongst Libertarians. According to our poll, 45% of Libertarians agreed that the wealth in the United States is too unequal (Upper-Left); on the contrary, 29% of Libertarians disagreed (Upper-Right). In addition to what we would call the Left vs Right divide on the question of wealth inequality, we also found that 26% of Libertarians were left undecided (Upper-Middle) on that question as well.
Many argued that wealth shouldn’t be equal, which isn’t what the question is asking, while others argued that government interference and entanglement in the free market are to blame for the wealth inequality. In addition to this, many respondents were initially confused by the E-F Model and had acquainted it with the Political Compass and the Nolan Chart, which are commonly used amongst Libertarians both young and old. Having learned this, we have determined that distinguishing the E-F Model from the Political Compass and Nolan Chart will be our next task following this study.
What does this mean for the Libertarian Party?
What this shows is that the Libertarian Party is split in three ways on the issue of wealth inequality in the United States, where 26% of the party has the potential to be persuaded to either side, which perhaps explains why there is such division and dysfunction within the party itself. Considering that our TIPP poll shows that “61% of the American people, including 56% of Democrats, 60% of Republicans, and 66% of Independents can be classified as Upper-Left,”[1] the greatest opportunity for the Libertarian Party to grow lies within their decision to embrace their inner 45% by promoting Upper-Left policies and candidates.
Upper-Left Policies: Policies that both shrink government and reduce wealth inequality.
- Freeze government spending.
- Audit/abolish the Federal Reserve.
- Abolish the federal/state income tax on all overtime pay.
- Increase the federal/state income tax exemption standard to $50k, $75k, or $100k. (Bottom-up tax cuts, not top-down)
- Abolish the sales tax on groceries/produce, medicine/vitamins, clothing, and additional healthcare products. (Necessities)
- Implement a “negative income tax” in place of UBI and to reform/consolidate the welfare state. (Options: Accept payout or exchange for food/medicine/housing/education vouchers at a 2:1 ratio)
- Stop U.S. funding/military aid to Ukraine & Israel.
- Leave NATO.
With 26% of the party left undecided on wealth inequality, there is also the opportunity to further expand upon that initial 45% as well. Perhaps moving the party in an Upper-Left direction can both unite the party and make it more competitive against Democrats, Republicans, and even other third-parties. By tapping into this unrepresented demographic, the Upper-Left, the Libertarian Party may finally break through the 1-4% threshold they have been stuck at for well over 50 years.
Source:
[1] Cottingham, Andrew. “Young Political Scientist Helps Build Case for New Political Map with TIPP Poll Results.” X (Twitter), 14 May 2024.
Leave a Reply